


 Reply With Quote
If we manage to get into the play off spots I'll add 1st and 3rd place forecast lines to the graph.

 Hall Of Fame
After todays win Notts currently sit joint 4th in the form table with Harrogate. W3 D2 L1.
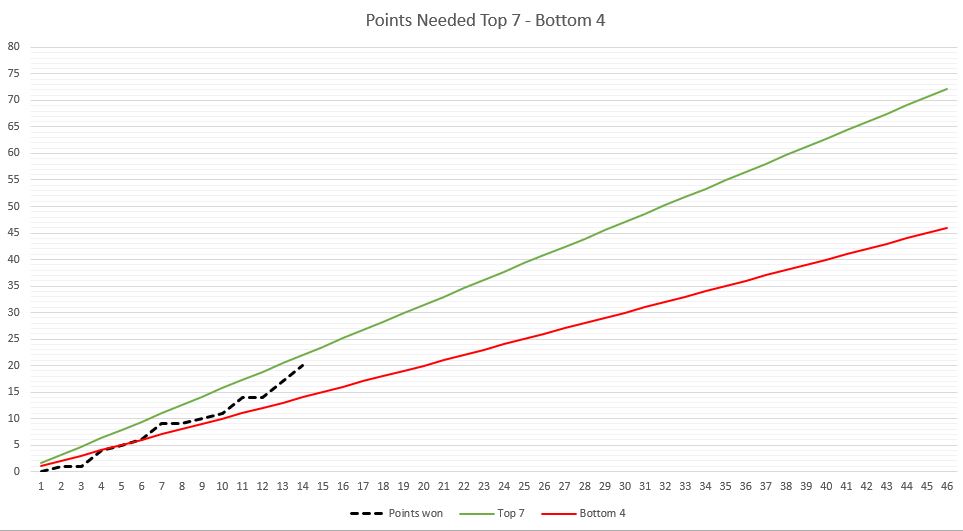
Points for 7th place currently hovering at just over 72. Relegation forecast has dropped slightly to 40 pts.
NA's PPG now for this season 1.43.
Hall Of Fame
If we manage to get into the play off spots I'll add 1st and 3rd place forecast lines to the graph.
Hall Of Fame
One more win to get us above the play-off line....Dover, our next opponents, have just conceded a 94th min goal, at home, to lose 2-0......can Notts do the same next Saturday?....bring it on......haven´t felt this good since J-Lo said she´d been keeping an eye on my Youtube vids and wanted to pop down to goat-land for a session on my kitchen table....then I woke up!
 Hall Of Fame
4th in the home results only table.
5th best defence,
8th best offence.
Only the away form is letting us down, 15th.
Next opponents Dover makes for incredible reading. 1st in the away table, 22nd in the home table!!!!!!!!
 Hall Of Fame
Is Keith Curle working for them?Originally Posted by upthemaggies

Hall Of Fame
Great chart for following our progress ncfcog, i love stats and numbers and charts i do stuff like this at work all the time, i know this has been mentioned already but something that i can't quite put my finger on feels wrong about adjusting the points required for 7th and 21st each week based on current ppg, its your chart and you can do what you want with but,
I think you can take 75 points for playoffs as a constant, there will be teams during the season who break out on runs and this line is going to be constantly shifting and all it is really doing is giving you a visual of the relationship between us and 7th on current form today and not over the long stretch of the whole season, itll be a case of chasing your tail right up to the final day
I'ts bugging me that i can't explain why its bugging me, i think we had a similar thing with the points required last season that did my head in for reasons i couldn't articulate, the 'constant' varies gameweek to gameweek and you never get a true comparison from one chart to the next and nothing becomes clear until the season is over and the line becomes a waste of time.
I do enjoy your chart though just an observation, i squint my eyes to block out the red line anyway
 Hall Of Fame
Seems sensible to reflect the current form. Take the premiership last season, you'd have been way out if you'd not taken into account the form of Liverpool and Man City. It smooths to reflect the real position as the season goes on.
Hall Of Fame
I think the point im trying to make is that the constant of the coloured lines is fine for looking at our relationship to 7th and 20th in a snapshot for any particular gameweek but if the predicted points total for the season keeps adjusting then the coloured lines would be a messy zigzag changing week to week throughout the season, the constant of chasing down 75 points becomes a variable based on current form of the team that is in 7th at that time.
7th place will change hands each week and that will affect to green line unpredictably
I would have said Liverpool and Man Citys form last year was an anomaly but city won the league with 100 points the year before so that became the new benchmark for taking the title meaning last season the chart would have looked exactly as predicted for the top teams,it was only surprising that two teams stayed on the line and not one.
Hall Of Fame
Thanks Brid.I did originally look at past 5 seasons and assumed 75pts would/should be the target {post 15) so I understand what you’re saying. However I realised this isn’t a KPI graph for the benefit of the team it’s a performance chart to map how we are doing in real time and to help forecast our final position throughout the season compared to key benchmarks ie playoffs and relegation.
As it stands it’s highly likely the points required for a playoff spot will be less than 75 but that could change and it will be good to monitor how that changes as the season progresses.
realistically that points target will likely be +/- 5 points so either way I don’t suppose it will have a dramatic impact on the chart.
Hall Of Fame
No worries , i love your chart but just im a bit ocd with things like this, if you remember last seasons thread on points required it caused some controversy because to many it was just a nonsense that could wildlly change game to game while others thought it was mathematical genius, the one predictable constant this year is that 75 will be required to ensure playoffs, im not saying 7th place will be at 75 but that if you reach 75 then you will certainly be involved in the final games of the season.
 Posting Permissions