


 Reply With Quote
BTW on current form with a form period of 5 games
Yeovil would win the league on 122 points
Barrow be in 2nd on 116 points
Allowing for a draw in their remaining head to head
Notts would finish with 84 points safely inside the playoffs
 Hall Of Fame
03.00 in the morning and its finally come to me why it feels wrong!Originally Posted by ncfcog

Lets say the team in sitting in 7th at any given week are currently on a ppg average of 1.5 ,your predicted 7th place points total is based on them earning 1.5 pts per game for the rest of the season and stayng in 7th
But.... a team right down in 15th place are 5 points behind them and are on a particularly good run and are getting 2.5 pts per game, the form team are the ones in 15th and their predicted total for the season will be considerably higher than the team currently in 7th but they are not considered at any point until they reach 7th which won't be for at least 5 games if everything stayed the same, but at the point they reach 7th the bar for finishing 7th takes a jump up which throws the target/comparison for Notts out of whack and our position on the black line in relation to the target green line changes unpredictably
In reality the team earning 2.5 pts per game will probably go on and get more than 75 points and not be the final target club to catch anyway as they will likely finish higher than 7th, thus there will be another unexpected wobble as the season comes to a close and our line in relation to the target green line will be up and down week to week right up to the last day of the season.
Soooooo to get an idea of our relation to 7th place right now or at any point in time you simply need to look at the league table, if you want a progress meter to show our likelyhood of finishing inside the playoff positions then 75pts seems the likely benchmark given previous seasons results show that to be the case.
A more complicated route which would take you much more time to sort out your weekly updates is work out the current form ppg for each of the 24 teams for a given number of games for what im going to call the 'form period' (5games?6games? 10 games?)and then add their predicted total based on current form to their actual points total to give you a final predicted table which would tell you how many points it would take to finish 7th
All of which would be nonsense because form is temporary and noone knows how a team will do over an extended period and all we do know for sure is that to be guaranteed a playoff place you need 75 points and to avoid relegation you need 50 points.
Tell me if i'm overthinking it....it is a nice chart
Hall Of Fame
BTW on current form with a form period of 5 games
Yeovil would win the league on 122 points
Barrow be in 2nd on 116 points
Allowing for a draw in their remaining head to head
Notts would finish with 84 points safely inside the playoffs
Last edited by bridpie78; 29-09-2019 at 02:21 AM.
 Hall Of Fame
Get all that Brid and some very good points in your previous post. It did dawn on me last night that you could just look at the table by using latest ppg so I think I will revert back to the original format where I took the average points needed for 7th and safety based on last 5 seasons. Originally the idea was these would set genuine targets, by changing to the dynamic ppg method it’s just showing how we are doing at that time compared to the teams in 7th and 21st.
Its a wet miserable Sunday and once I’ve walked the dog and done a few jobs I’ll have nothing better to do
Hall Of Fame
This makes me very happy
Hall Of Fame
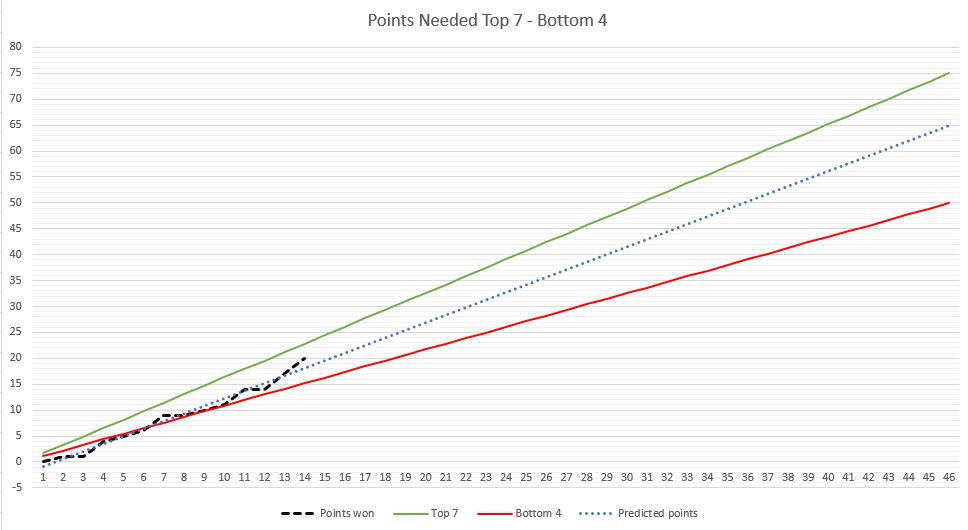
Ok so after some very good points raised by Bridpie I have reverted back to the original 'targets' of 75pts will get you in the play off's and 50pts will see you safe. By doing this we still have clear targets to aim for (hopefully top 7). With the dynamic target lines changing every week it would be no different to just looking at the league table.
To make it a bit more interesting though I have added a trendline to our actual progress which 'predicts' how many points we will finish on at the end of the season based on our actual PPG to date. So as you can see in the graph below after 14 games if we continue to gain points at the current rate we will finish on 65-66pts. A couple more wins and this prediction will increase, likewise lose a couple and it will decrease.
I'm a big fan of Ben Mayhew and his statistical analyis which you can find on his website https://experimental361.com/ If I can find the time I will try to replicate some of his analysis so it is relevant to Notts as I don't think he is doing NL stats this season.
Hall Of Fame
Perfect!! i might get some sleep tonight
Hall Of Fame
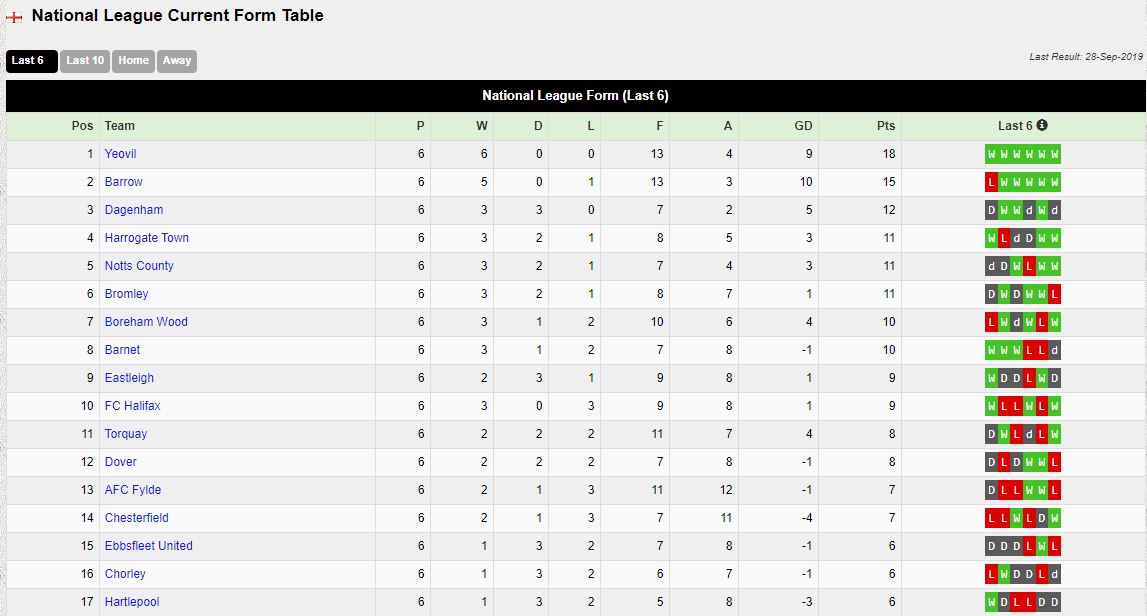
Current form table for last 6 games https://thefishy.co.uk/formtable.php?table=5
Hall Of Fame
So having spent most of this afternoon trawling google for match stats it appears obtaining reliable match data for non league is in fact pretty much impossible. Was happily working away on data from UK Soccerway until I got to the Chorley game and it recorded just 1 shot on target for Notts, in a game that we actually scored 5 goals! Also, some games have absolutely no stats at all other than goals and goal scorers.
Any stats site suggestions much appreciated. Maybe some of the betting sites might have historical match data?
Hall Of Fame
its hard to find anything on individual matches,even assists you'd probably have to watch match highlights and award them yourself you might like this one though for overall stats and tables and form
https://www.soccerstats.com/pmatch.a...nty-chorley-fc
there is no way betting sites will hold match data for anything beyond 24 hours after the game itd be an awful waste of capacity for them for no reason
https://www.soccerstats.com/latest.asp?league=england5
 Hall Of Fame
I know not strictly form related but I thought I post a link to the latest National League odds.
Weve moved into 12s for the title. Somewhat surprisingly Bromley are fairly short odd favourites, but Yeovil look a better bet to me.
https://www.oddschecker.com/football...-league/winner
 Posting Permissions