


 Reply With Quote
Makes you feel all tingly insideOriginally Posted by Masson4


 Hall Of Fame
Shades of the Masson-Stubbs combination from dead-ball kicks many winters ago. Inch-perfect delivery to the head of a fairly unstoppable force like Stubbsy.
 Hall Of Fame
Makes you feel all tingly inside
Hall Of Fame
With no game this week I've got an opportunity to put some time into this so will post something once I've had chance to work through it.
Hall Of Fame
It's no wonder my business is struggling, I never do any work!
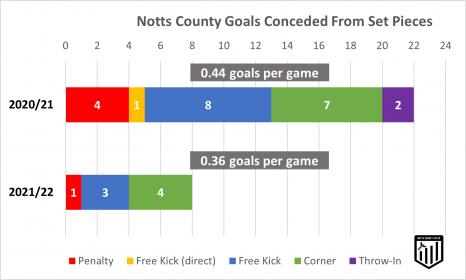
Here's the same chart for goals conceded. Note that we let a couple in from long throw-in's last season, arguably something we've been better at defending this season.
Whilst both the charts provide an overview of how we compete at set pieces it doesn't necessarily tell a concise story. Therefore the new found analyst in me has decided to now calculate how many of each action we had or faced so we can drill down on effectiveness. For example we may have scored 6 goals from corners out of 36 meaning a 16.66% success rate whereas 6 goals from 26 corners would mean 23% success rate.
Anyway here you go . . .
 Hall Of Fame
So to work out the differentials goals scored v conceded, 2020/21 we were -0.06 goals per games, 2021-22 its + 0.19 goals per game, so a +0.25 goals per game improvement on last year. Coach Clapham and the players should take a bow
 Hall Of Fame
So basically were scoring a goal every other game from a set piece, and have already scored more from corners than the whole of last season. Conversely, were conceding a goal every three games from a set piece - which is also an improvement on last season, when it was closer to one every two games.
Now we just need to find our shooting boots outside the box, as I dont recall many 25-yard screamers this season.
Hall Of Fame
Should add to this that I think 3 goals conceded from set pieces this season came in one game, Woking.
Hall Of Fame
Also the lack of long range efforts this season probably has more to do with the way IB prefers to create chances in the box because statistically you have a greater chance of scoring.
Hall Of Fame
It was interesting this afternoon going through all of last seasons goals.
Losing players to covid and still playing the Maidenhead game was probably a mistake as we could have easily had that game postponed as others did.
It also showed what a big miss Wes Thomas was. At the beginning of last season him and Wootton looked like world beaters. In the games after that we started to look pretty average and I think the long range efforts were symptomatic of our lack of real attacking threat.
By the end of NAs reign we were probably going backwards and that penalty defeat to Hornchurch was a prime example of that.
It was a frustrating hour or so going through those videos!
Hall Of Fame
I guess if it’s good enough for Pep and Man City, it’s a good enough model for us.
 Posting Permissions