Vaccine Effectiveness Drops Below Zero in 18-29 Year-Olds for First Time – But Boosters Appear to be Helping
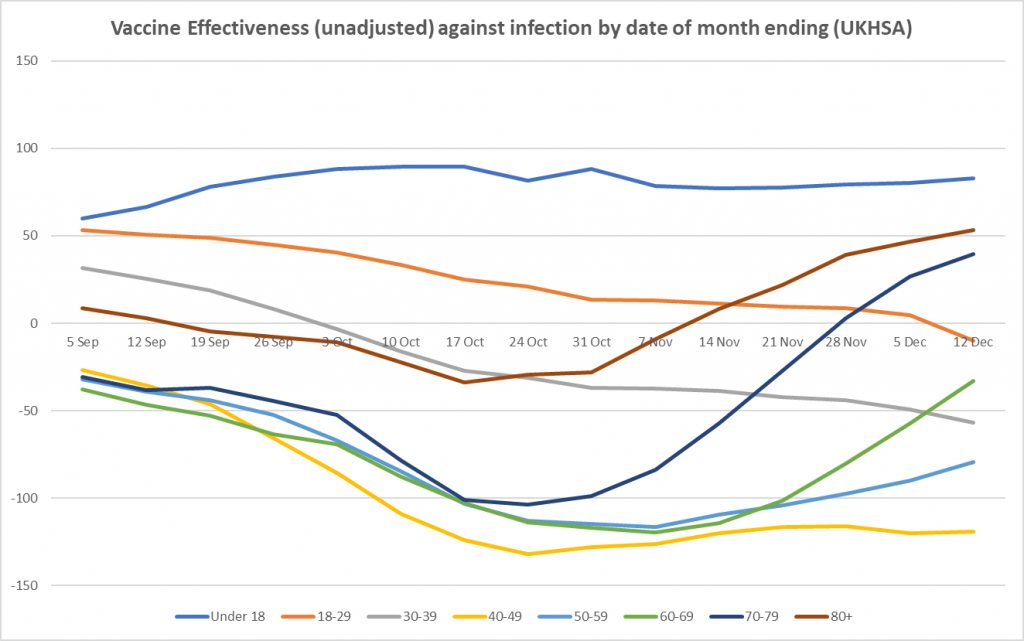
The latest UKHSA Vaccine Surveillance report, containing data for the month ending December 12th, brings mixed news on the vaccines. First the bad news. Unadjusted vaccine effectiveness based on the raw reported infection rates is still negative for all aged between 18 and 70 (see above). In fact, it’s gone negative for the first time in 18-29 year-olds, down to minus-10.1%, after a sharp drop in the last week. A negative vaccine effectiveness means the infection rate per 100,000 people is higher in the vaccinated than the unvaccinated. This means that vaccine passports and vaccine mandates will be ineffective at preventing transmission, and indeed it implies that the vaccinated are actually a higher transmission risk than the unvaccinated. Far from protecting the vaccinated from the unvaccinated, then, as much current policy seems intended to do, perhaps the unvaccinated should be wary of the company of the vaccinated. For those in their 40s in particular, unadjusted vaccine effectiveness is minus-119%, meaning the vaccinated are more than twice as likely to be carrying the virus than the unvaccinated.
The goods news, however, is that the boosters appear to be having a significant impact. Unadjusted vaccine effectiveness has been rising in the older age groups for some weeks, and is now solidly positive in the over-70s, albeit at a not-very-impressive 39.5% in 70-79 year-olds and 53.3% in the over-80s. That this rise is likely due to the third doses is indicated by the fact it has occurred in staggered fashion in each age group, apparently in line with when boosters were rolled out.
What appears to be the case to the casual eye has been put more rigorously to the test by Dr. Richard J. Booth, a retired civil servant with a Ph.D. in mathematical statistics. In a new piece published by the Daily Sceptic today, Dr. Booth undertakes statistical analysis to compare the booster rollout rates in each age group with the changes in the relative reported infection rates to see if there is any correlation over time. He explains:
"It occurred to me that since the third doses have been deployed at different rates in the different age groups, it might be possible to observe, and analyse, a ripple of decreasing infection rates from older to younger people over the last few weeks. So I developed a statistical model for infection rates, including a value dependent on the week (because the epidemic progresses at a rather unpredictable rate from week to week), and a week-dependent value proportional to the number of people who two or more weeks earlier had had the third dose compared with the number having had at least the first dose. I divided out the infection rate data by its value in the first week, to put the different age ranges on the same footing."
He concludes that what appeared to be the case is validated by his model, and the booster rollout correlates well with the changes in relative infection rates.
"I conclude that though three doses of vaccines may have been effective from the outset, statistical support for that proposition via these sources did not become apparent until week 44’s data was published, when nearly half of over 80’s had had boosters two or more weeks earlier, but has been sustained since then. Of course, ‘statistical support’ is not a cast-iron proof, as correlation is not causation and there might be ‘unknown unknowns’ at work. Nevertheless it is highly suggestive that the prior statistical work on Covid vaccines is vindicated here."
While not all readers will follow every detail in Dr. Booth’s thorough and technical article, it is well worth checking out.
https://dailysceptic.org/2021/12/17/...to-be-helping/


 Reply With Quote